


Thursday, October 27, 2005
Testing evolutionary hypotheses and the evolution of science blogging
As you may have seen The Commissar has been constructing a family tree based on who inspired bloggers to get into blogging. A worthy project and one you should contribute to if you can and haven't yet.
The Commissar's data combine to make a history of the branching patterns that have given birth to some of the blogs out there today. Scientists visualise these patterns using something called a phylogenetic tree or phylogram. Just for fun I made a phylogram relating the science blogs in The Commissar's data:
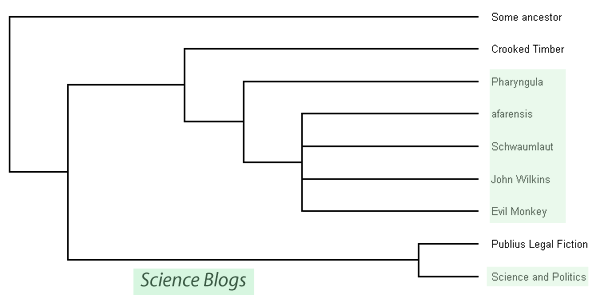
Phylogram relating science blogs. Constructed by putting made up sequences into CLUSTAW, tree created with TreeView Blogs represented: Science and Politics, Legal fiction, Crooked Timber, Pharyngula, Afarensis, John Wilkins, Schwaumlaut & Notheory(Kin Selection), Evl monkey.
I'll talk about what our little phylogram has to say a little bit later. First I want to say how scientists usually make their ones. The Commissar's data shows us an exact record of the branching that created the blogs in question. Sadly we don't have an equivalent record of the evolution of all the species on earth. We can't go back in time and watch as ancestral plants gave rise to other plants that would eventually give rise to the flowering plants or record the great protostome-deuterostome split. The fossil record can give us a clue as to what happened but the earth is just nowhere near big enough to fit a fossil of every animal that ever lived. Rather, we have to infer the relationship between extant species but looking at what makes them similar and what makes them different.
The most successful approach to relating the earth's organisms goes by the name of cladistics. Imagine we have five flowering plants, we know they are related to each other but we're not sure about exactly how the relationships work. A cladist would attempt to detangle this problem by collecting lots of data on the plants; maybe including flower colour, leaf shape and number of flowers per growth tip. Each of these would form a 'character' and each observation a 'character state'. So a red flower would be recorded as the character state 'red' for the character 'flower colour'.
Next they'd infer which character state the common ancestor of all the plants in question was likely to have for each of these characters. To do this the data generated from the plants being studying is compared to that of some more distantly related plant - often called an 'outgroup.' Finally with this in mind a cladist constructs branching trees that best describe the evolutionary history of the organisms, the best tree is considered to be the one in which the involves the least total number of changes in character states. So, if two of the flowers have red flowers and the other three blue then the best tree is likely to split the red and blue flowers early on like this one that only predicts one change:
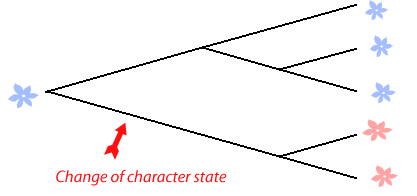
Groups of organisms that share a common ancestor and represent all the descendants of that ancestor are called a clade. So in this example we have a red flowering clade and a blue flowering clade. Another way of imagining the way cladists work out relationships is to say that they draw trees that have as much similarity within clades as is possible and confines most differences to between clades.
Of course, if you really based you analysis on one character like flower colour you' be leaving yourself open to error caused by convergent evolution. Plants not particularly closely related to each other can develop red flowers independently then get grouped together. And in fact flower colour is particularly evolutionarily liable because different pollen donors (bats, lizards, insects, birds) are enticed by differently coloured flowers That sort of error can be avoided by using lots of characters, especially selectively neutral ones.
In recent times phylogentics - like almost all of biology - has been swept by the introduction of molecular techniques. You have 3.5 billion letters of DNA in your genome, that's an amazing resource - 3.5 billion characters that can have one of four different character states. More and more DNA sequences are being used to work out species relationships with some exciting results and the most popular techniques are based on caldistics. If we choose the genetic sequences and statistcal measures we use to infer species relationships carefully we can create really quite authoritative phylograms that we can then use to test evolutionary hypotheses.
Let's take another look at our science blog phylogram.
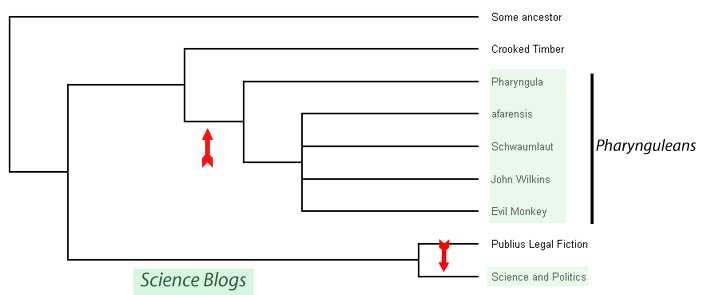
Since we know this is the true relationship for these blogs we can actually learn something about the way science blogging has evolved. If we presume these blogs evolved from an ur-blog here reverently labelled 'some ancestor' then we can see that two independent lineages of blogging have some up with the idea of science blogging, each of these events is shown by an arrow in this picture. So, the most parsimonious explanation is that an admirer of Crooked Timber by the name of PZ Myers built himself a blog that dealt, in part, with scientific matters, that event precipitated a whole clade of other science blogs I have called the 'Pharynguleans'. Coutrunix also stared blogging on scientific issues, independently of the Pharynguleans. I should also point out that using the terms in their technical sense political blogging is a primitive state and science blogging a derived one.
Of course, this is all a little silly. Blogs don't really come into existence by spawning off from other blogs like species do. So let's look at some real evolutionary problems that phylograms have been used to investigate.
The galaxiids are an ancient family of scaleless, freshwater fish. New Zealand has about 20 species of galaxiids, most famous here because the juveniles of five species make up the whitebait runs.


Two of NZ galaxiid's species (Giant Kokupu and Koaro) surround their most famous role - whitebait fritters
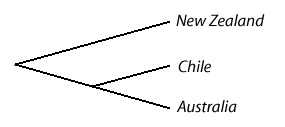
Globally one species of galaxiid, Galaxias maculates, is found in New Zealand, Australia and Chile which has lead some people to presume that the common ancestor of all the galaxiids arose in the super continent Gondwana and the other forms have evolved divergently since that continent broke up. If this is true we would expect to see the relationships between the three country's G. maculatus populations reflect the order in which the continents broke from Gondwana. That would mean the closest relationship would be between the Chilean and Australian populations with the New Zealand populations considerably more distant:
When DNA phylograms are constructed for these populations we find the relationships are actually like this:

So an evolutionary hypothesis is disproved by better data. In fact, it now seems more likely that the galaxiids got themselves to Chile and Australia by dispersal from an ancient Antarctic population and various Australian glaxiids made it to New Zealand more recently. That hypothesis was, by the way, first proposed by none other than Charles Darwin.
Most galaxiids spend some of their younger life out to sea where they swim in the plankton. As juveniles they return to freshwater where they finally mature. Most New Zealand's galaxiid species have given up this migratory phase to become 'stream resident' It has been proposed that one group of non-migratory galaxiids called the G. vulgaris complex all result from a single geological event - the uplift of the Southern Alpes or the formation of a Miocene lake - causing a population of the migratory G. brevipinnis to become landlocked. If that was true then we would expect to see a phylogram something like this
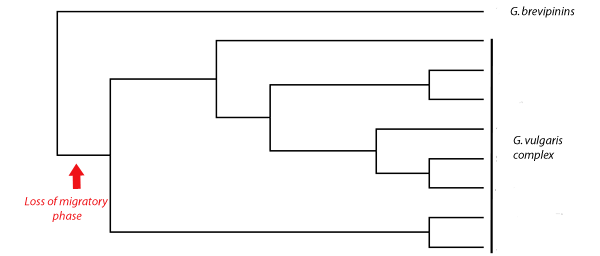
Here all of the non-migratory G. vulgaris lineages are related to one common ancestor. But when a phylogenetic tree of these fish was created using mitochondrial DNA sequences this was the result.
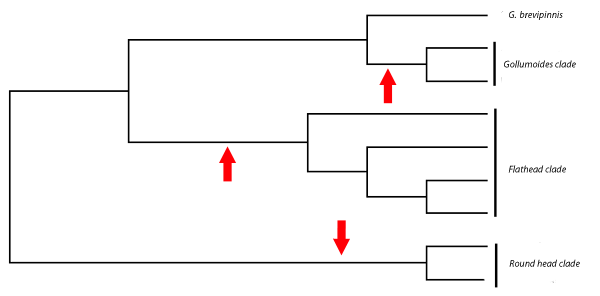
The red arrows represent independent events that lead to the loss of migratory stage from the life cycle. So, again a good phylogram has allowed us to test an evolutionary hypothesis. This time we've shown that G. brevipinnis populations have actually given up the migratory part of their life cycle on three different occasions in New Zealand's south island to give rise to the G. vulgaris species complex.
By combining these data with others from other south island species we can learn how ancient geological events like mountains popping up or river captures have shaped our biota. If we can calibrate these data with a reliable molecular clock for the lineages we're studying then we have a very powerful tool for investigating how biological and geological processes have worked in concert to produce the flora and fauna we are lucky enough to share the world with.
Some references:
Wallis and J. Waters (2003) The phylogeography of southern galaxiid fishes, in The Natural History of Southern New Zealand University of Otago Press, Dunedin
Wallis and Waters (2001) Cladogenesis and loss of the marine life-history phase in Fresh Water Galaxiid Fishes (Osmeriformes: Galaxiidae). Evolution 55:587-597
10 Comments:

Also, I could also point out that Science And Politics, a generalist, spawned Circadiana, a specialist.
BTW, Coturnix is misspelled...
RPM – you’re right, the relationships would be better portrayed with a big network BUT a) I’m lazy b) I was really using the phylogram bit as a gimmick to trick people into learning about phylogenetics ;)
Coterneex – Sorry to you and all the other quail fanciers. Don’t take it personally. Of people that have no (known) learning disorder I may be the worst speller that there is.
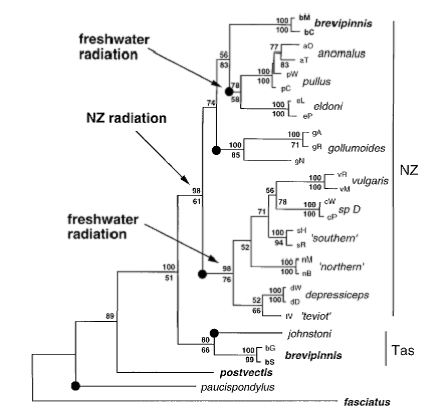
Aneides – You got me! These aren’t the real phylograms, I made some more tidy ones since the picture is actually a little more convoluted. G. brevipinnis is found in Australia as well so the real tree looks like this (TAS means Tasmania, anomalous to teviot are the vulgaris complex)
[Aparrently I'm not allowled to post pics in the comments of my on blog so the tree is here]
So, Australian G. brevipinnis made it to NZ once then ‘spawned off’ the various vulgaris lineages. I thought I might try and save people thinking about a group of species within what is usually defined as one species!
If you think the post can help your bio students then I’d be stoked that you sent them here.
There is a considerable equivocation in the literature about the relationship between phylograms (histories), cladograms (classifications) and dendrograms (diagrams of both the relationships and the amount of change for some characters such as genetic states).
I like play online game, I also buy mesos and maple mesos, the cheap mesos is very cheap, and use the maplestory mesos can buy many things, I like maple story mesos, thanks, it is very good.
